The propensity to cycle tool is best known for, and most often used as, an interactive web application for strategic cycle network planning. However, the PCT is also a research project, open source codebase, and open access data project. Many people are not aware that in addition to viewing data on transport patterns and cycling potential at multiple levels, you can also download and use the data, enabling use cases that are simply not possible within the constraints of a web browser.
An advanced training workshop was organised to address this issue, and to help build capacity of people who have some experience with the PCT but want to take their analysis to the next level. The workshop was funded by the Department for Transport as part of Phase IV of the project and was delivered as part of the Cycle Active City 2021 conference in 2 parts on 25th August 2021. The good news for anyone who was unable to attend the conference in person is that all the materials from the events have been made freely available, to minimise barriers to entry to the world of data driven sustainable transport planning focussed on active modes and cycling, the active mode with the greatest potential to replace unsustainable car trips. The new free and open teaching materials can be found at itsleeds.github.io/pct/articles/getting.html and there is a video to accompany the new material, including live demos using R and QGIS.
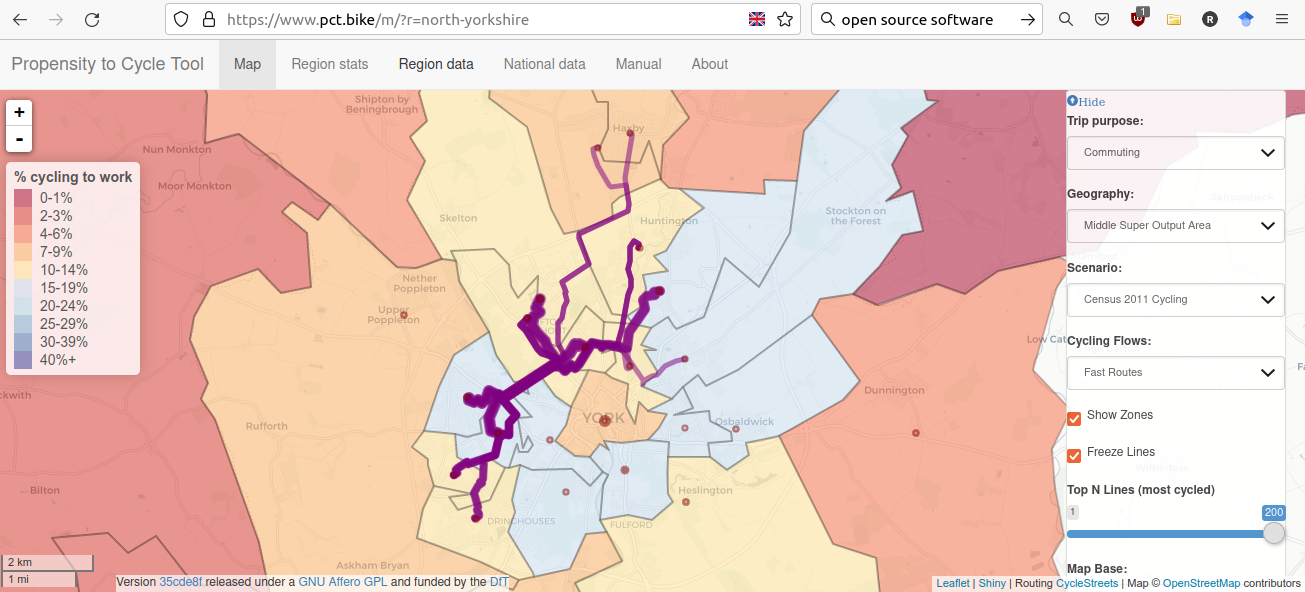
The first workshop was focussed on downloading and exploring PCT data, with a view to using it address questions that cannot easily be answered using the PCT’s web interface. The starting point was using the tool in the web browser. A live demo was used to show how the Freeze Lines toggle could be used to highlight routes passing through a particular point, the zones served by Clifton Bridge in York being the example that was selected, as shown below.
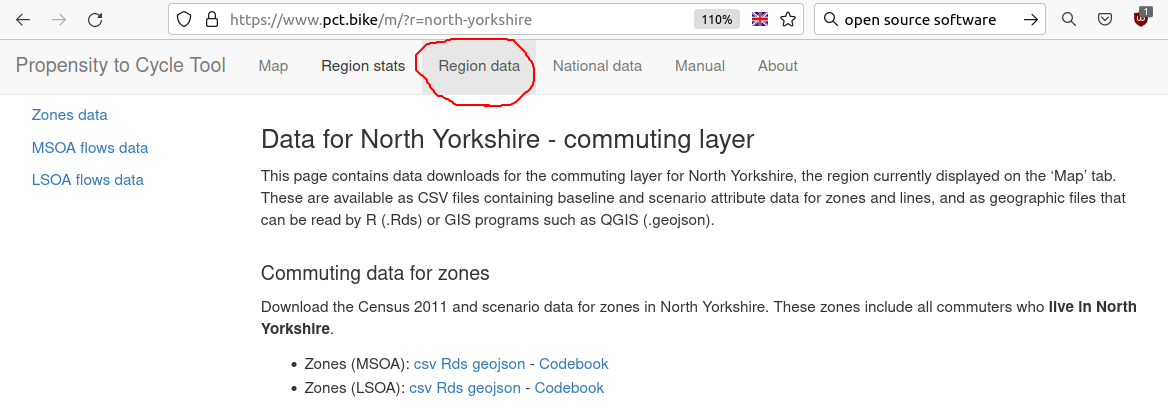
After establishing the usefulness of this analysis, the next stage was to download the data. One workshop participant said that the didn’t realise that the data underlying the PCT could be downloaded for free, by clicking on the Region data tab. We downloaded zone, route and route network data for North Yorkshire, as illustrated below.
At this point we switched to using QGIS, a popular free and open source desktop Geographic Information System (GIS). Participants learned how to reproduce the same analysis shown above for Clifton Bridge in QGIS, and the potential advantages of doing so, compared with online systems such as the PCT and cloud-based services like ArcMap online. With the data in QGIS you can, for example, calculate additional attributes of routes passing through a particular point, such as average route distance, the potential total cycle KM per day served by the particular piece of infrastructure, and, when linked with other datasets, contextual information such as speed limits on and around the routes. This is illustrated below.

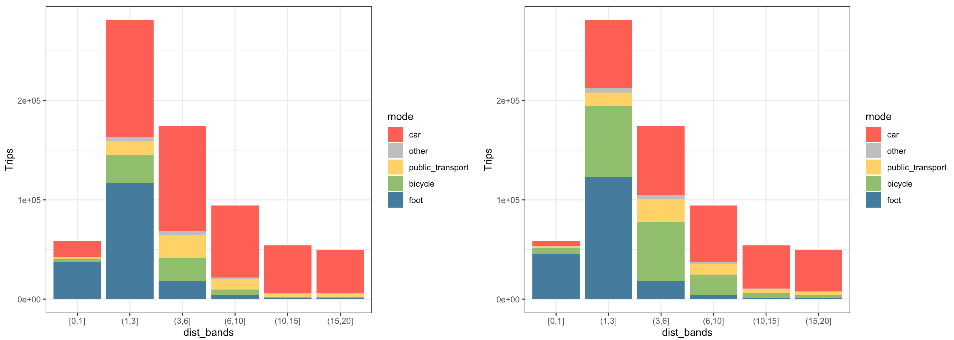
The second workshop was for advanced users who had prior experience with the statistical programming language R. In it we developed a Go Active scenario that met the government’s aim for 50% of trips in towns and cities to be made by active modes, in North Yorkshire and for single stage commutes at least, to demonstrate the concepts and methods. As shown below, this scenario led to increased walking and cycling for short trips but led to only small (17% by distance) decreases in car use.
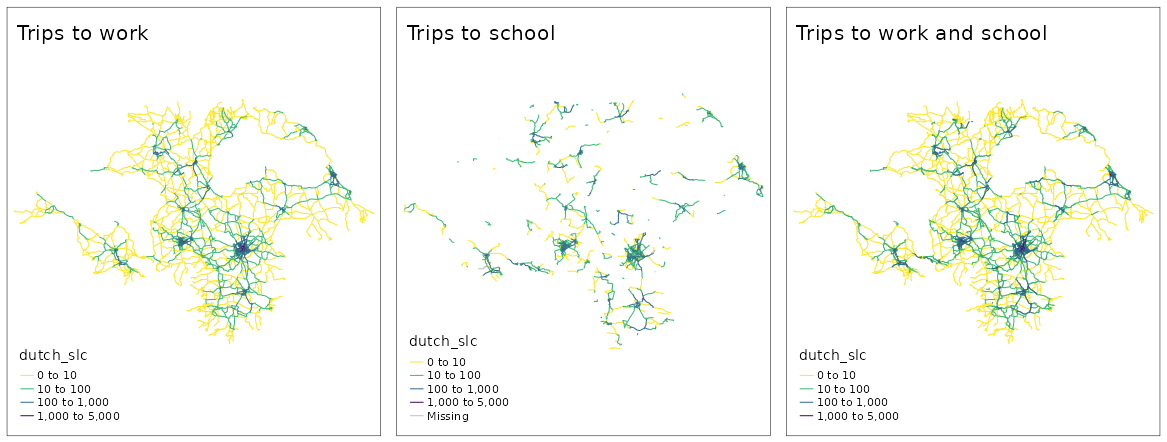
We also developed a scenario called Go York to model what would happen if the rest of North Yorkshire had as much cycling as York does, accounting for differences in trip distances and hills in different parts of the region. We also demonstrated how to join commute and travel to school route networks, resulting in a more comprehensive and balanced network, as illustrated below.
If you would like to learn more about the training session and work through the exercises, you can find a detailed tutorial on Getting and using data from the PCT at itsleeds.github.io/pct/
