We are happy to announce that, after almost 2 years in the making, the Schools layer is available in the Propensity to Cycle Tool. We have coincided the launch of this layer with the publication of a paper (freely available here) that describes the underlying methods and results, in the Journal of Transport and Health (Goodman et al., 2019).
When we originally designed the PCT methods, in late 2014 and early 2015, we needed to use a dataset that was accurate, had high geographic resolution, captured a high proportion of trips and, ideally, was open access (Lovelace et al., 2017). Accordingly, we used the origin-destination data from the the 2011 Census. Freely available at MSOA level (each of which contains about 7000 people) from the WICID data portal, we converted these large tabular datasets into even larger geographic datasets, which led to the development of the stplanr R package (Lovelace and Ellison, 2018).
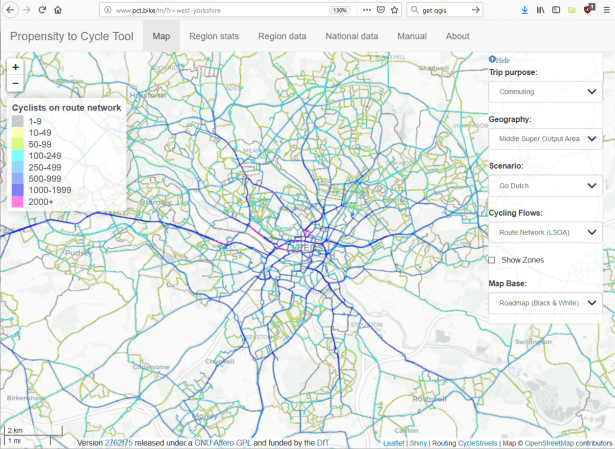
A limitation of this dataset, and the subsequent LSOA level data that was released in March 2017, was that it only covers commuting; and commuting is less than 20% of all trips. The kinds of network recommended by commuter cycling data tend to be arterial routes to town centres, which is where employment destinations are concentrated. This is illustrated in the figure below, showing the commute Go Dutch scenario for Leeds.
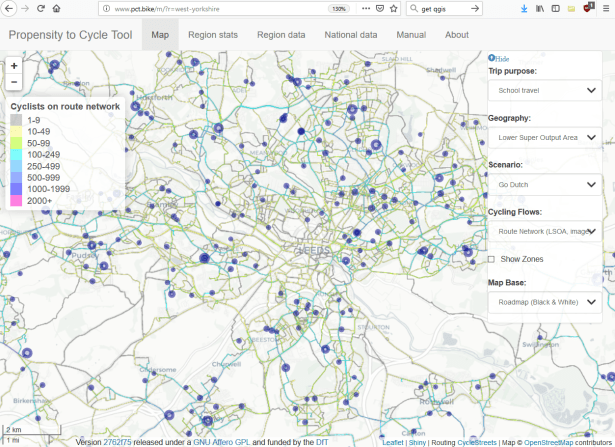
The newly released PCT Schools layer uses the data from the 2010/2011 School Census. This was the last year that the School Census collected travel-to-school origin-destination data similar to that available for travel to work. The Schools layer highlights residential networks because schools are scattered outside central areas, in the suburbs. As illustrated in the Figure below, the Schools network for Leeds is a denser, more diffuse network, emphasising ‘orbital’ rather than ‘arterial’ routes.
Thus the PCT Schools layer highlights the need for interventions in residential areas complementing high quality infrastructure on main roads. For children, mixing with motor traffic is even more of a problem than for adult cyclists. Making residential areas safe for cycling to school is likely to involve substantial reductions in volumes and speeds of motor traffic, as well as protected routes on major roads. This will also help those commuting adults (disproportionately women) who combine travelling to work with the school run, as outlined in an article for The Conversation.
How to use the schools layer
To use the schools layer you just need to select ‘School travel’ in the first dropdown menu when you are using the tool in one of the regions (e.g. see http://www.pct.bike/m/?r=west-yorkshire for the tool working for West Yorksire, or http://www.pct.bike/m/?r=avon for Avon). That will make the zones and route network desire lines available for travel to school. Desire line and route datasets are not available for confidentiality reasons. Furthermore only 3 scenarios are available for the School travel layer:
- School Census, which shows the low current levels of cycling to school
- Government target, which represents a doubling of school cycling nationwide
- Go Dutch, which is based on travel to school trips in the Dutch Travel Survey
As with the Commuting layer, these can be selected from the Scenario dropdown menu.
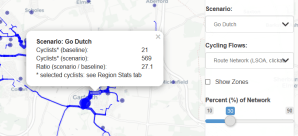
In the Cycling Flows dropdown menu, you can select from the ‘Route Network (LSOA, clickable)’ option (shown below for Garforth) or the ‘Route Network (LSOA, image)’ option. Both have advantages: the clickable ‘vector’ layer can show estimated levels cycling on specific road segments, as shown in the figure below. The LSOA image is faster to load and provides more coverage (the clickable layer only shows from 30 to 90% of the network and only contains segments with 10+ trips under the Go Dutch scenario).
As with the Commuter layer, the Schools layer is designed to be used interactively to support evidence-based decision making (Lovelace et al. 2017). It should complement local knowledge, community engagement and consultation, especially as school locations and catchments may have changed since 2010/11. And as with the Commuting layer, the scenarios are snapshots of what could happen if cycling levels were to increase uniformly nationwide, not what will happen if specific interventions take place. The PCT is a strategic planning tool and does not recommend specific interventions: other tools, transport planning expertise, and reference to the literature will help with that (Parkin 2018). As with the Commuting layer, we also calculate health and carbon benefits. For the PCT Schools layer we provide information on change in MET hours (metabolic equivalence of tasks – a measure of physical activity) per child, as well as change in CO2 emissions.
School data downloads
As with the commuter layer, we have made the underlying data available to download for stakeholders and researchers to do further analysis and support data-driven analysis and policy. For each region, the files that can be download are (with representative links for geojson files for West Yorkshire):
- Zones, at the LSOA level, with data on cycling uptake among citizens in each area, available as a geojson
- Schools, outlining cycling potential to each state school:geojson
- Route Network layer, available as a geographic file: geojson
The national data can also be downloaded. Please cite the paper (Goodman et al. 2019) if you do use this data as the source, available to download in a range of file formats:
See the Region data tab in the tool for further information.
References
- Lovelace, Robin, and Richard Ellison. “Stplanr: A Package for Transport Planning.” The R Journal, vol. 10, no. 2, 2018, pp. 7–23, doi:10.32614/RJ-2018-053.
- Lovelace, Robin, et al. “The Propensity to Cycle Tool: An Open Source Online System for Sustainable Transport Planning.” Journal of Transport and Land Use, vol. 10, no. 1, Jan. 2017. Census data, http://www.jtlu.org, doi:10.5198/jtlu.2016.862.
- Parkin, John, 2018. Designing for Cycle Traffic: international principles and practice. London: ICE Engineers. https://www.icevirtuallibrary.com/isbn/9780727763495
