Like any quantitative model, the Propensity to Cycle Tool (PCT) relies on data, and the nature of that data affects the results. Because open travel to work datasets between MSOA origins and destinations were the best travel data available when early versions of the PCT were developed in 2015, commuter data was the sole source of travel behaviour data in the first versions of the PCT.
This reliance on commute data had impacts on the PCT’s results: it emphasised ‘arterial’ routes to major employment hubs, not residential zones. In March 2019 we addressed this issue by deploying a new ‘travel to school’ layer, providing estimates of cycling potential to state schools in England, as outlined in a previous blogpost. In this blog post we’ll show how combining both commute and travel to school layers can result in a ‘whole network’ estimate of cycling potential (see report here for full details).
Taking Birmingham under the Go Dutch scenario as an example, we can see that travel to work potential focusses on the main routes into the city centre (see http://www.pct.bike/m/?r=west-midlands and click on the Cycling Flows and Scenario dropdown menus to get an interactive map):
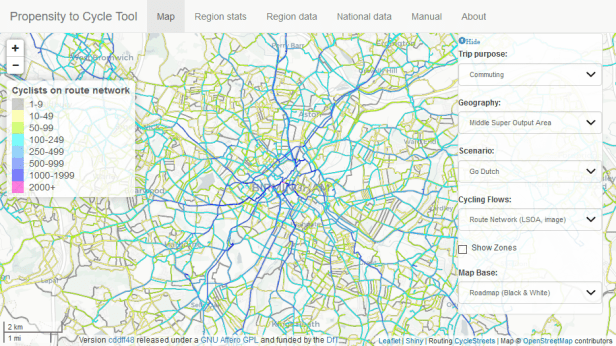
The commute route network layer highlights the kind of routes where cycleways are needed to enable mode shift to cycling on a major scale to take place in large cities such as Birmingham. The PCT has been used to assess future cycling demand for the Birmingham Walking and Cycling Strategy, assisting with the planning of a city-wide cycling network. This contributes to a draft Birmingham transport plan which includes ambitious proposals to ban through traffic from the city centre. It also strengthens the suggestion that around 100,000 cars per day could be removed from central Birmingham areas under scenarios of high cycling uptake, with huge benefits for citizen health, air quality and road safety.
The travel to school layer shows that, when other trip purposes are replaced, the potential to remove traffic from the streets is even greater. The travel to school route network is different, highlighting an intricate network of streets along which thousands of ‘school commutes’ could be cycled:
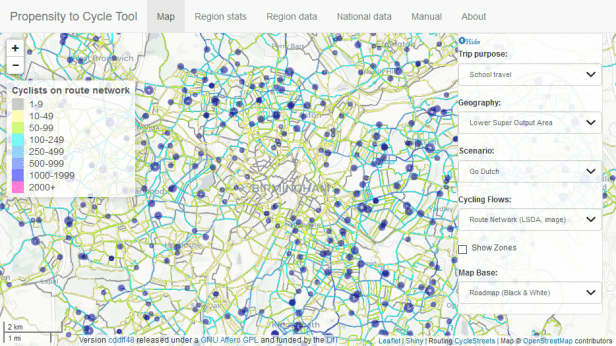
The new report explores the idea of a combined ‘commute-school’ network layer that shows what an integrated cycle network could look like. This could include wide, smooth and direct protected cycleways along the key commuter corridors, and a network of ‘liveable streets’ to ensure safe routes to school.
The result of combining these two layers does indeed seem to provide an approximation of what a ‘whole network’ approach to cycle planning could look like. The figure below, from the report, shows 4 networks with line width proportional to estimated network potential: 1) commute potential, 2) travel to school potential, 3) commute-school combined potential, and 4) weighted commute-school potential.
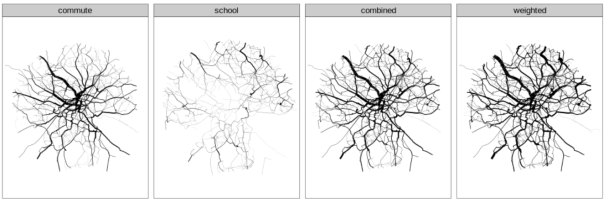
In the final plot estimated travel to school potential is multiplied by a factor of 2 to highlight the residential networks that must become safe and cycle-friendly for mode shift to happen on non-commute trips. The doubling is based on the assumption that other types of non-commute trips, including short trips to the shops and to visit friends and family in the local area, will have a similar distribution as trips to school.
This assumption may not always hold, but in Birmingham only 36% of cycle trips are for work and education, while 39% are for leisure and 25% are for shopping and other purposes. This certainly highlights the importance of creating not just arterial routes, but a whole network approach to strategic cycle planning. For the full report, by Dr Joey Talbot and Dr Robin Lovelace from the PCT team, see here.
