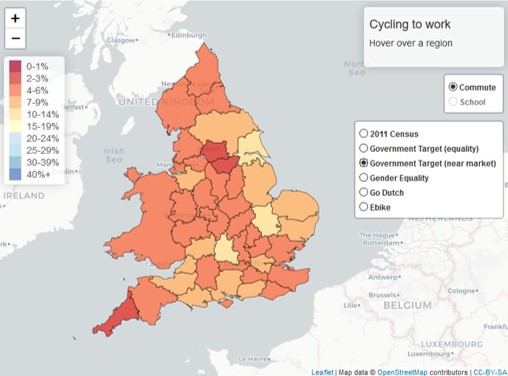
Announcing a new commute layer: Government Target (Near Market).
In the UK, cycling take-up is unequal across a range of demographic variables. Yet where cycling levels are higher, many of these inequalities are reduced or eliminated. In the Netherlands, gender inequality is reversed – women cycle a higher proportion of their trips than men do. In Cambridge, women and men cycle to work at similar rates.
This was why our initial PCT scenarios were equity-focused. We wanted to concentrate on cycling potential and avoid reinforcing existing demographic inequalities. And for ‘Go Dutch’ and ‘E-bikes’, the step-change in cycling levels is so transformational that it’s hard to imagine this happening without all parts of society being included.
However, for Government Target, the change is more incremental. While a large relative increase – doubling by 2025 – in absolute terms this represents growth from 3% to 6% of commuters. Therefore, we decided to produce a demographically-weighted scenario, for comparison with what we’ve renamed Government Target (Equality).
While Government Target (Equality) models the overall doubling in cycling as solely a function of trip distance and hilliness, Government Target (Near Market) models the same as a function of trip distance and hilliness, plus various sociodemographic and geographical characteristics (including age, sex, ethnicity, car ownership, and income deprivation) that are currently associated with propensity to cycle commute in England and Wales.
To do this we needed to change how the data work in the PCT. Previously we used an aggregate approach. However, this doesn’t let us look at correlations between e.g. car ownership, age, and gender. We have now moved to a more flexible individual level calculation (‘microsimulation’). Because this approach is hopefully more accurate and to be consistent we redid all the scenarios using this individual level approach. This means there will be small changes in results for the existing scenarios.
For both Government Target scenarios, cycling overall doubles at the national level, but at the local level this growth is not uniform, in absolute or relative terms. In both scenarios, areas with many short, flat trips and a below-average current rate of cycling are highlighted as having stronger potential for growth. The Government Target (Near Market) scenario also highlights those low-cycling areas where the potential cycle commuters are demographically more similar to current commuter cyclists.
Which scenario is best to use? It will depend on local knowledge and reasons for using the PCT. Comparing the two scenarios could, for instance, be useful in highlighting areas and routes where many new cyclists would come from traditionally under-represented demographic groups (like women or older people), which might make outreach and promotion more important.
Training
We continue to offer free training funded by DfT, with priority for local authorities, to allow people to learn more about use of the PCT (including this new scenario). Basic and intermediate training focuses on using the interface and the data downloads, with the next dates being 20th June and 16th July in London (register here).
Advanced training focuses on manipulating the PCT code base using R, which can for instance be used to construct bespoke scenarios. This will also soon be open for booking for dates in May and June.
