Improving physical activity modelling
We have made three improvements to how we model physical activity impacts in the Commute layer:
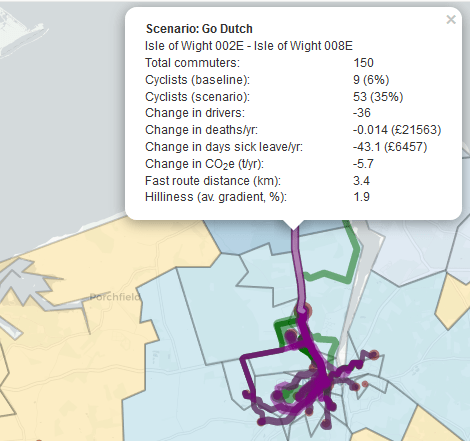
- We now estimate cycling and walking speed, and physical activity energy expenditure while cycling and walking, as a function of route hilliness. This means that we now better capture that cycling a given distance in a hilly area involves more energy expenditure, and therefore brings higher health benefits, than cycling the equivalent distance in a flat area.
- We now estimate impacts on mortality in terms of the reduction in Years of Life Lost (YLLs) as well as the reduction in deaths. We now also quantify the health economic benefits in terms of this reduction in YLLs, rather than in terms of the reduction in deaths. The advantage of using YLLs is that they capture the difference between avoiding a death at age 30 (which would incur many Years of Life Lost) versus a death at age 70 (which would incur fewer Years of Life Lost). It is also more consistent with what is done in Department for Transport TAG guidance. Note that we have also made minor changes to how we calculate the number of deaths avoided, to be consistent with the latest TAG guidance.
- We now additionally estimate the reduction in sickness absence, and associated economic benefits, from a given increase in physical activity.
These additional metrics can be found for each scenario in the pop-ups and in the data downloads. Further details are presented in User Manual C1.
Scenario impacts on additional modes
For the commuting layer, our data downloads have until now presented how numbers of cyclists, walkers and car drivers change in each scenario. We now use the same method additionally to present changes in numbers of car passengers, motorcyclists and public transport users.
Streamlining the data downloads
The improvements described above have added a considerable number of new variables for each scenario to the data downloads. To keep overall file sizes more manageable, we have streamlined how we present scenario values.
Specifically, until now we have included two variables for each health and carbon metric: ‘Scenario impact compared to a no cycling counterfactual’ and ‘Scenario impact compared to Census 2011’. We now instead include just ‘Scenario impact compared to Census 2011’, which we believe is the variable of interest for the vast majority of users. We have, however, also added a new variable for each metric, ‘Census 2011 impact compared to a no cycling counterfactual’. This reduces the number of variables per metric (from ‘5 * 2 = 10’ to ‘5 + 1 = 6’, given the current 5 PCT commute scenarios). Users are still able to recreate all the old variables should they wish to as follows:
‘Scenario impact compared to a no cycling counterfactual’ = ‘Scenario impact compared to Census 2011’ plus ‘Census 2011 impact compared to a no cycling counterfactual’.
For consistency we have introduced the equivalent changes in variable inclusion to the PCT Schools layer. The Schools layer is otherwise unaffected by these improvements to the Commute layer.

Very useful changes, thanks!
LikeLike